Five year review (2011 – 2015): insolvency statistics
Grand total
Administration – 57
Liquidation – 12391
Receivership – 954
Total – 13402
What are the important trends in the numbers over the past five years?
- The volume of appointments is lower than it was pre- global financial crisis.
- Certain business sectors such as are manufacturing, dairy, and peripheral service industries that support those sectors are struggling. While the big business and farms find themselves in financial trouble, they are no longer able to pay suppliers who pay a vital role.
Detailed Insolvency Statistics for End of 2015
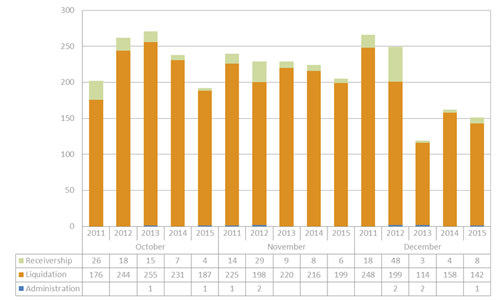
October, November & December Comparison of Insolvency Appointments 2011, 2012, 2013, 2014 & 2015
Grand total
Administration – 10
Liquidation – 3012
Receivership – 217
Total – 3239
What are your thoughts on the insolvency statistics from 2011 – 2015? How will 2016 look? Any feedback, inquiries, predictions or comments are welcome. Please email Simon at sdalton@gerryrea.co.nz


