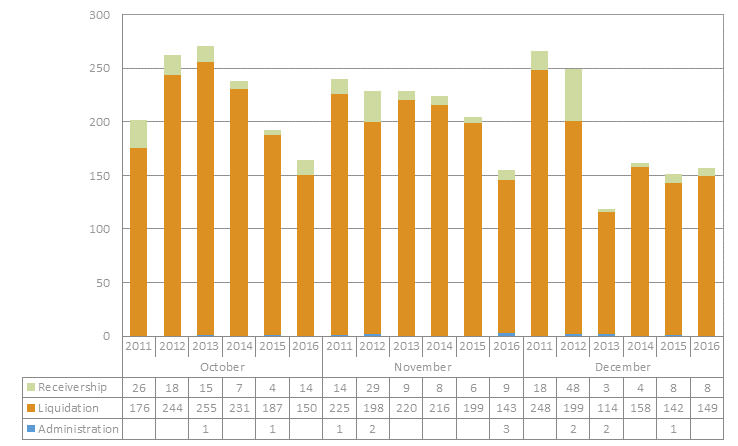
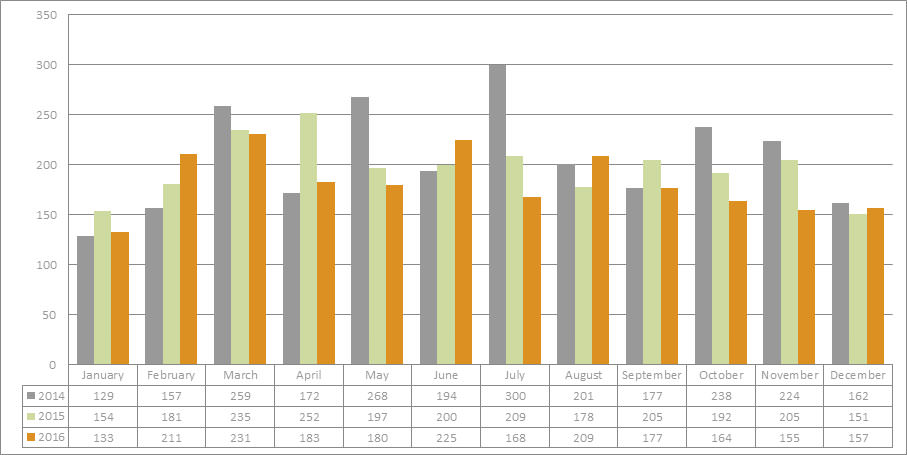
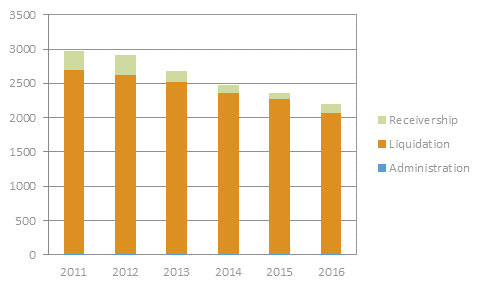
 How does 2016 compare thus far to the last five years?
Year by year comparisons (2014-2016)

Market commentary – what does the housing market look like?
2016 did not ended with a burst bubble as some predicted.
Yes, the market has slowed down as the total volume of houses sold decreased, but the average price for a house continues to increase. Figures from Barfoot & Thompson show the average sale price increased by 8.6 per cent last year.
The average sale price in December was $913,709 and the median price was $840,000. It was, according to Barfoot and Thompson managing director Peter Thompson, a “typical December trading period”, with sales numbers and new listings in line with those for the previous year.
“December’s modest price retreat is similar to that which occurred last December and it took until March for the upward price trend to re-appear. New listings at 776 were the lowest in a month for the whole year, but were the highest in a December for five years.”
Million dollar properties accounted for 39.1% of the month’s sales with 282 sold.
Meanwhile, the sale of properties under $500,000 accounted for 7.2% of the month’s sales with 52 sold.
The data fresh in for January suggests that the number of applications made for new mortgages has dropped in January which may reflect a cooling property market. The bubble may not have burst in 2016 but will it in 2017?
What are your thoughts on the insolvency stats? What’s your prediction on the housing market? Will the bubble finally burst in 2017? Please email Simon at sdalton@gerryrea.co.nz

